Results
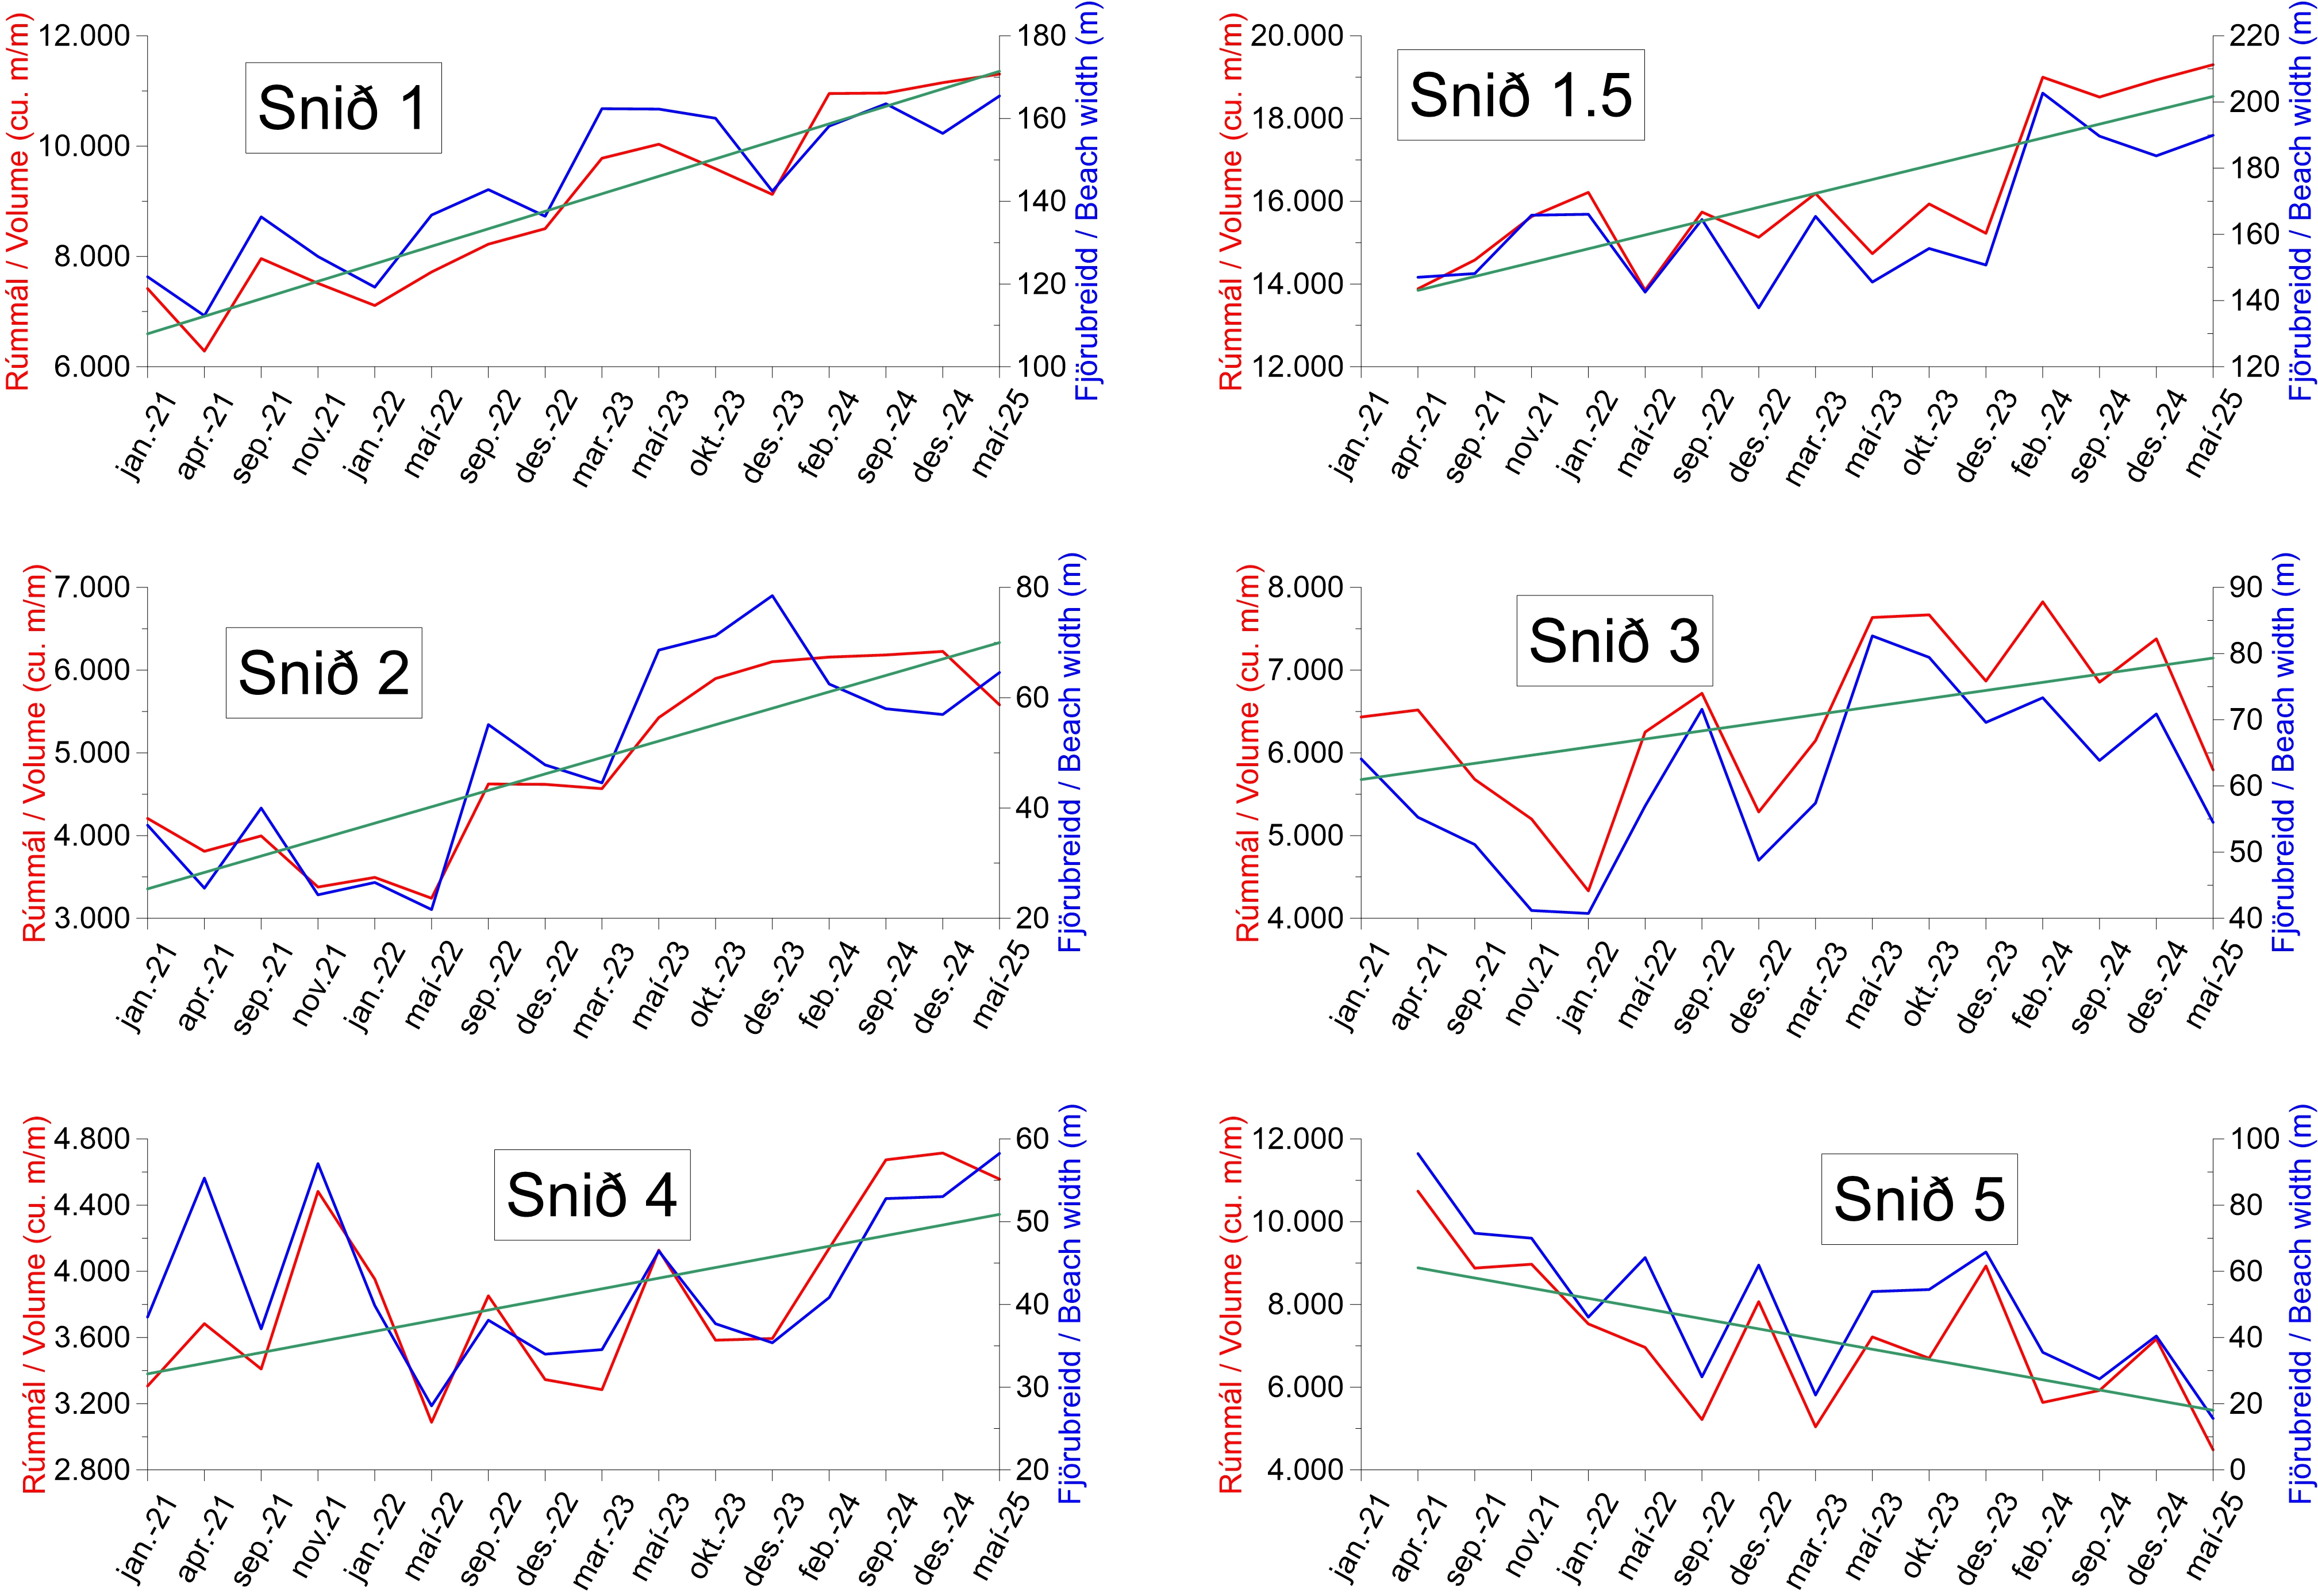
To examine changes in the beach between measurements, the width of the beach at a height of 1 m is calculated together with the volume of the profile, and these results are compared with previous measurements. The results can be seen in the tables and graphs below.
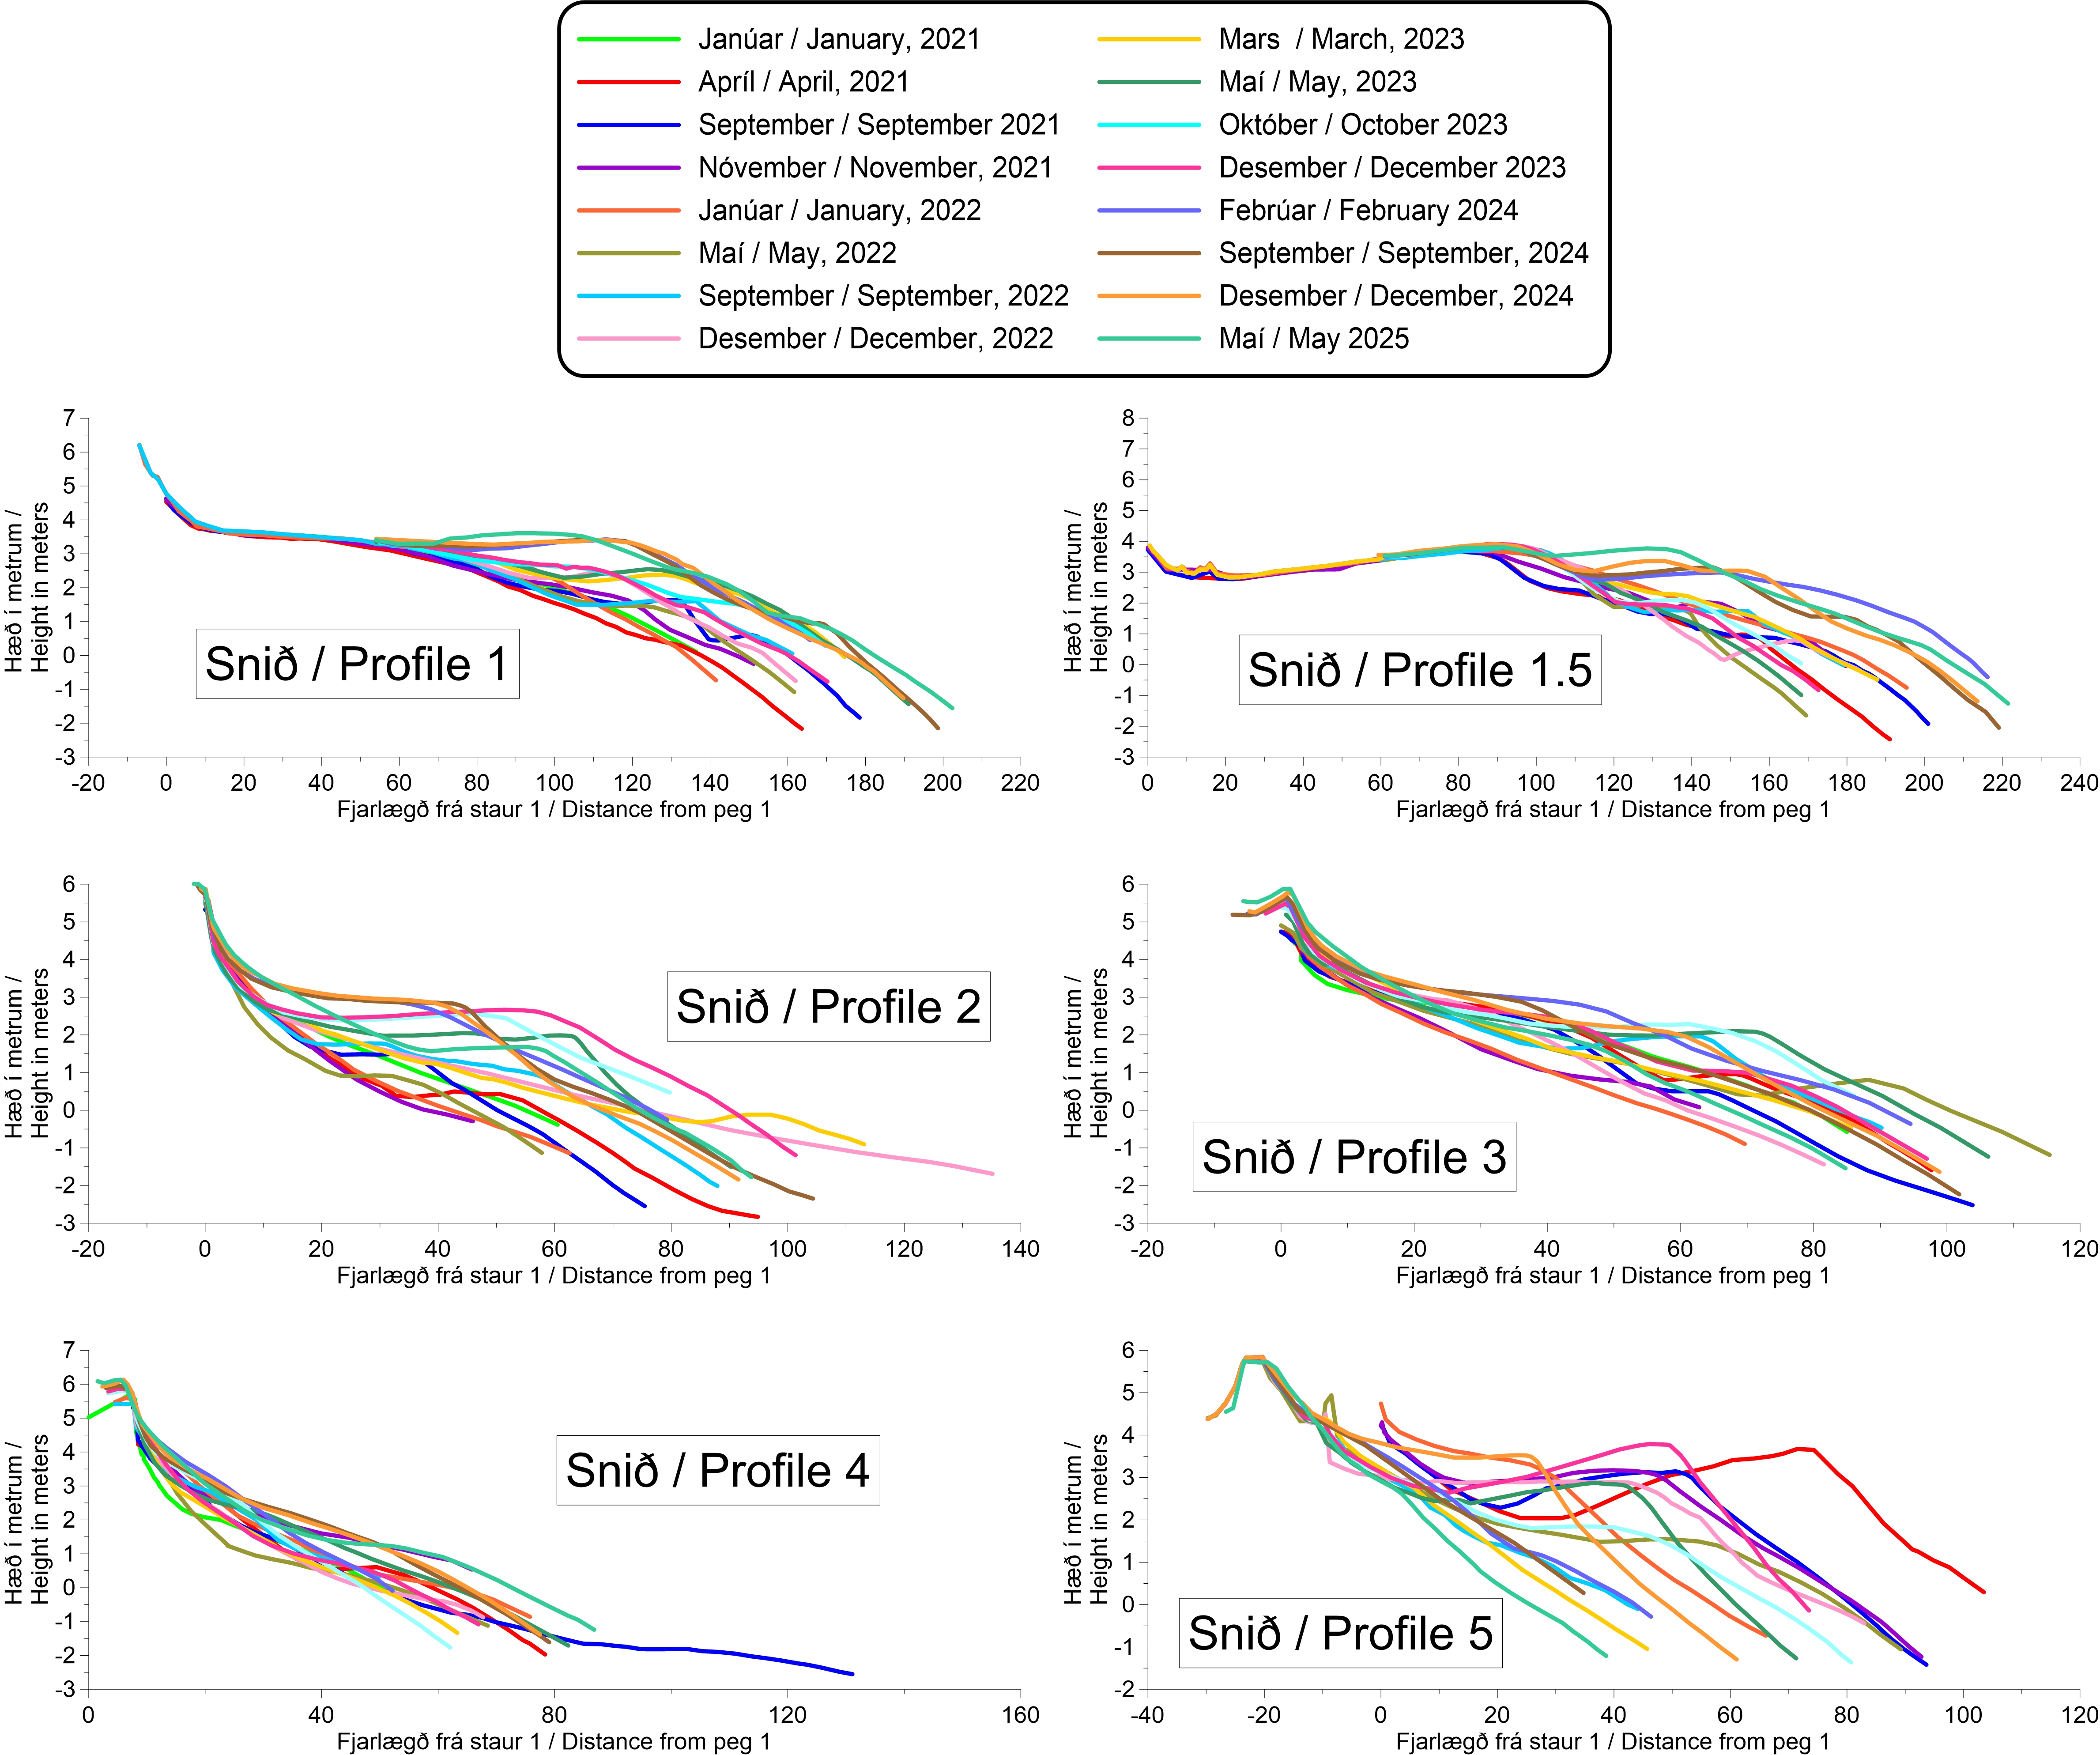
Profile 1 has been increasing its width and volume steadily since the measurements began. Between the two last measurements, the profile width and volume decreased, but in the long term, the profile is growing.
Profile 1.5 has also been increasing its width and volume, but has been more unstable than profile 1, as the profile has been growing and decreasing alternately. The profile has declined slightly since last measurement, but in the long term, the profile is growing.
Profile 2 decreased in width and volume over the first few measurements but had a large increase between the measurements in May and September 2022. Since then, there had been a slight decrease in the width and the volume until May 2023, when it started to increase again and has continued to do so since. In the long term, the profile is growing.
Profile 3 has developed similarly to profile 2, i.e., decreased at first but then grew from January to September 2022. There was a sharp decline in the measurement in December 2022, but started to recover, but now in the last two measurements the profile has declined. In the long term, the profile is growing.
Profile 4 has been relatively unstable, alternating between growth and decline. However, it decreased quite a lot between November 2021 and May 2022 and that decline has mostly remained. Between the measurements in October and December 2023, there was not a large change on the profile and in the long term the profile is also relatively stable, neither decreasing nor increasing.
Profile 5 has been slowly shrinking since measurements began, but the beach was somewhat unusually wide and high when measurements began. The profile has increased its volume and width since the last measurement but is still decreasing in the long term.
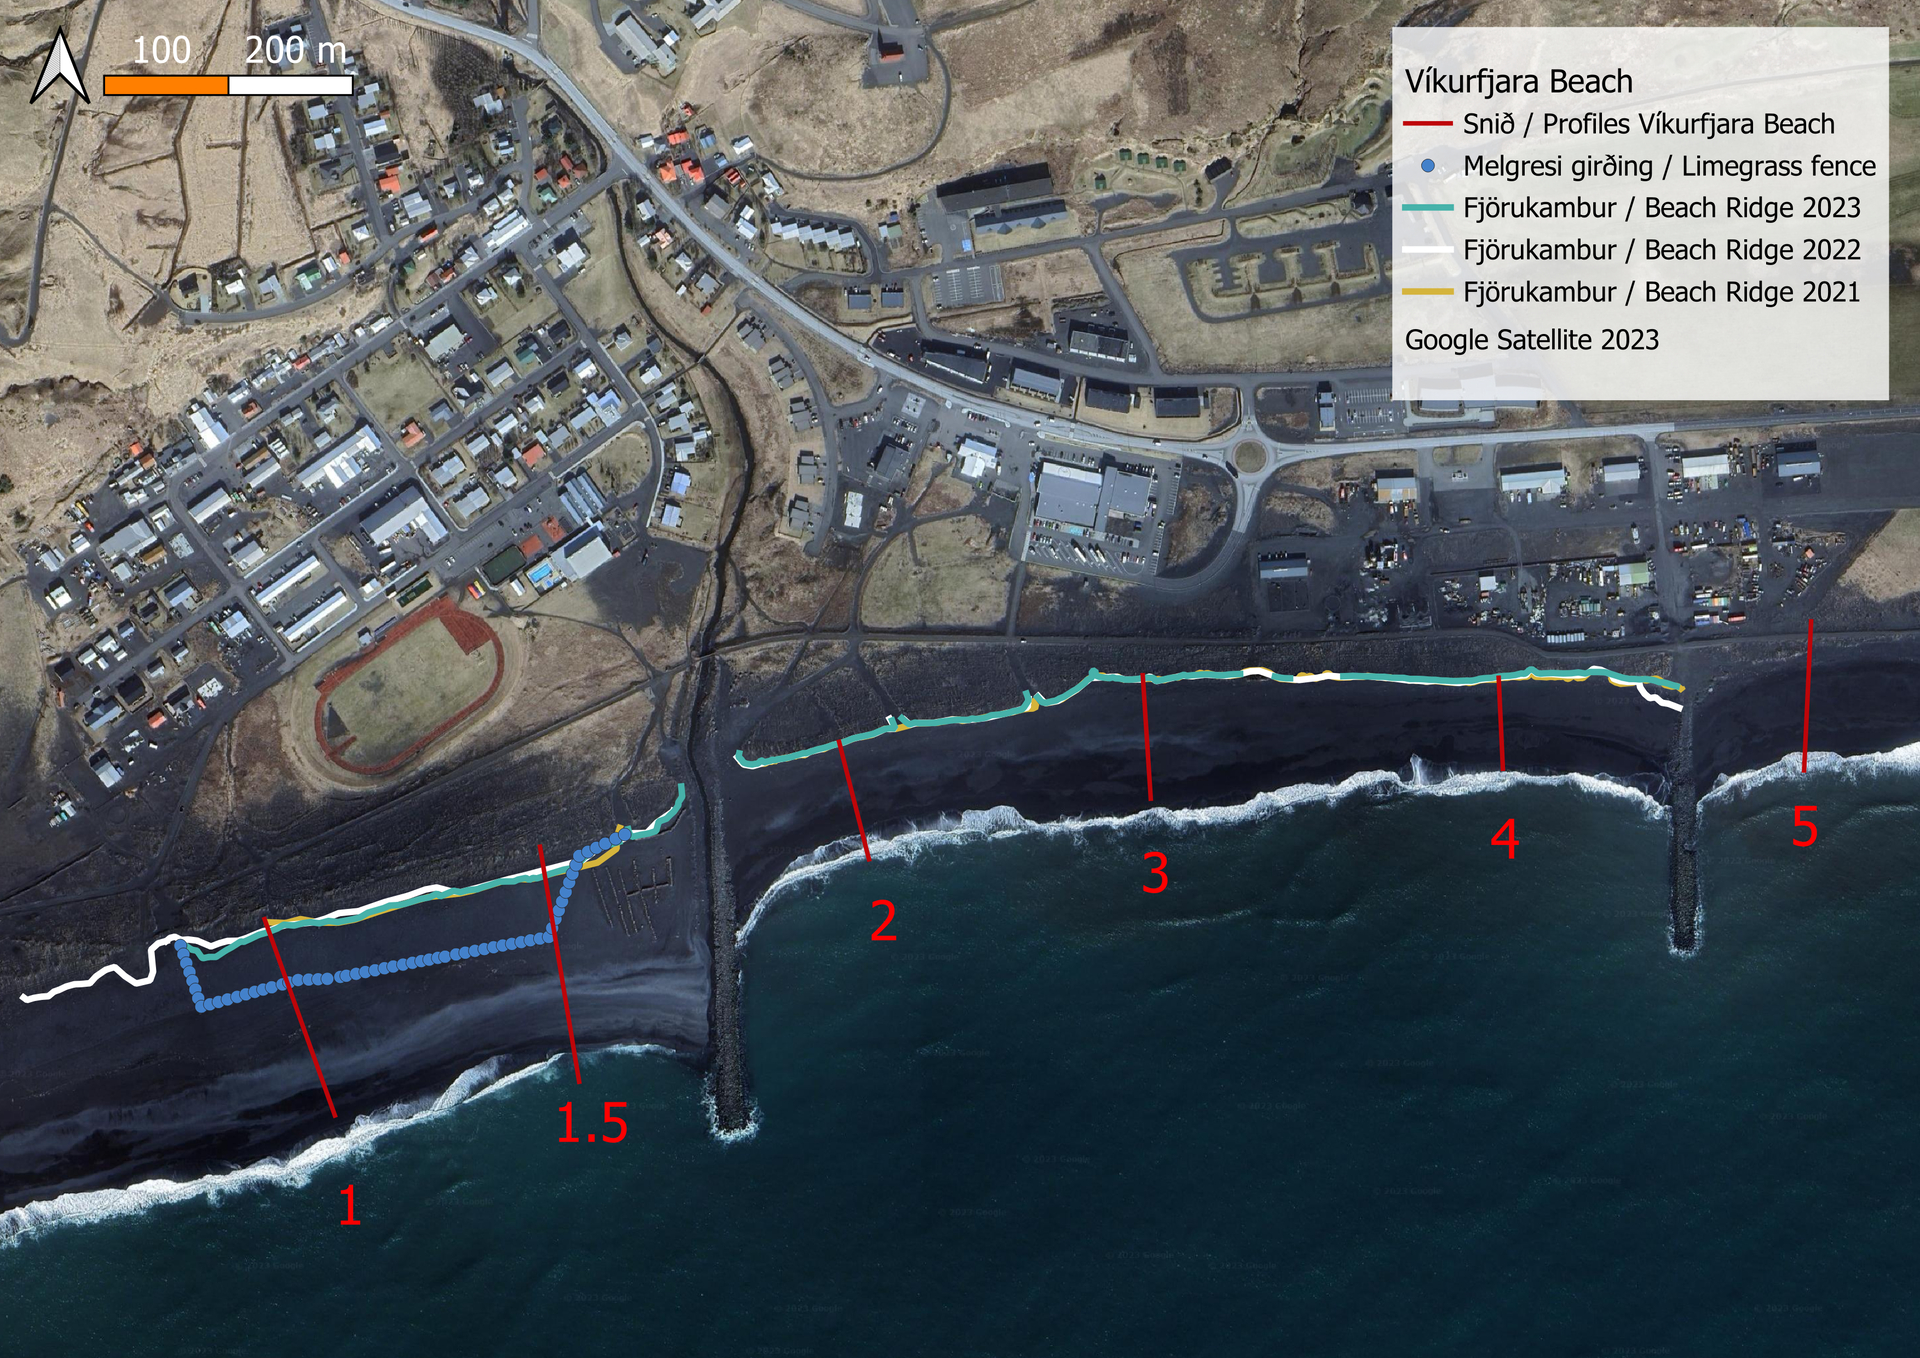
The students also measure the position of the beach ridge once a year and this is done to check the stability of the beach ridge at Víkurfjara beach, to check if erosion is taking place or if the ridge is stable or even advancing.
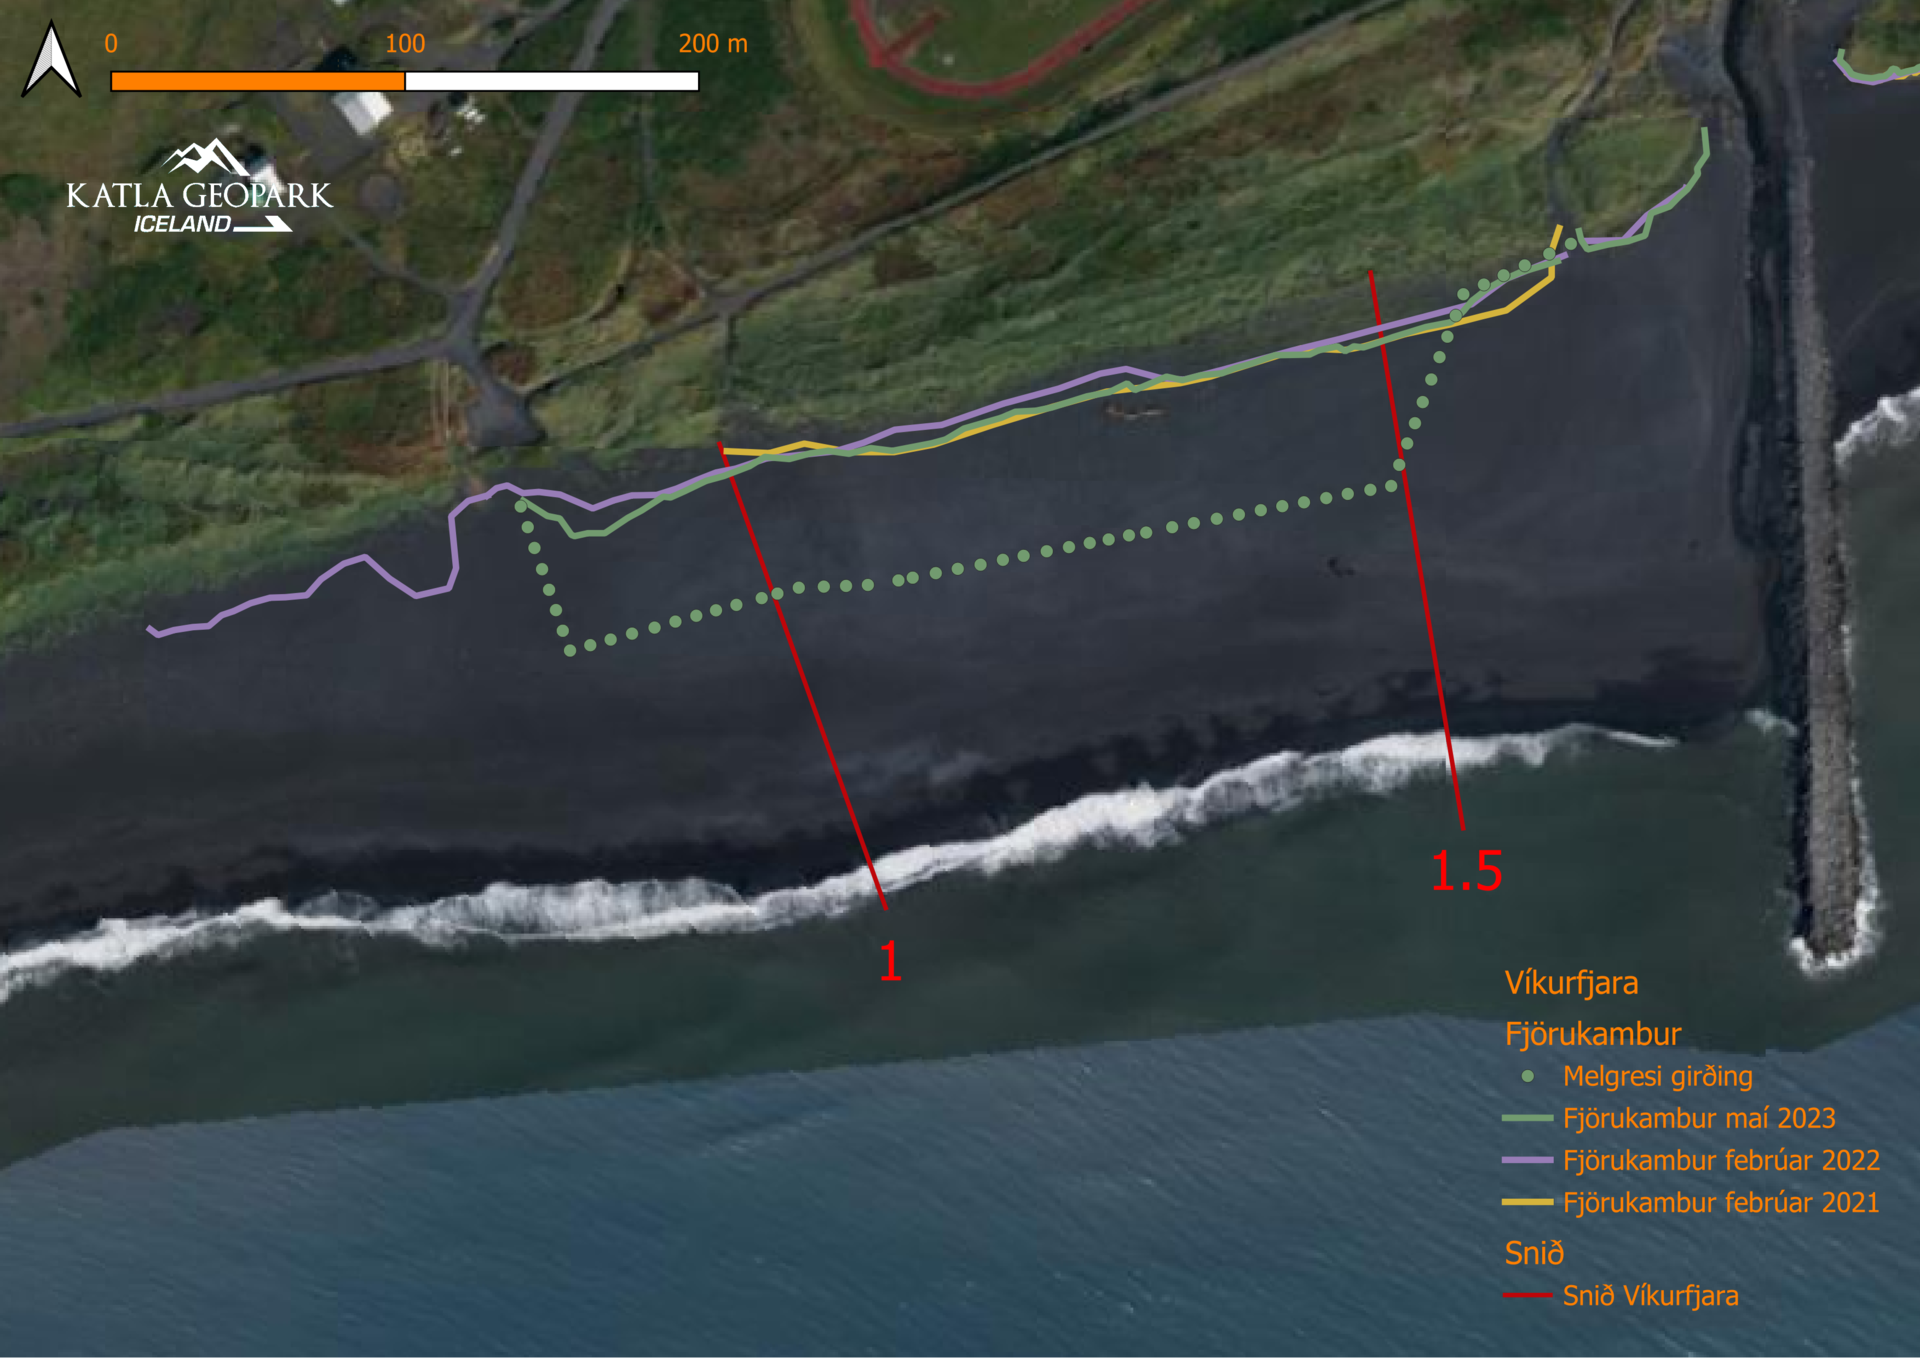
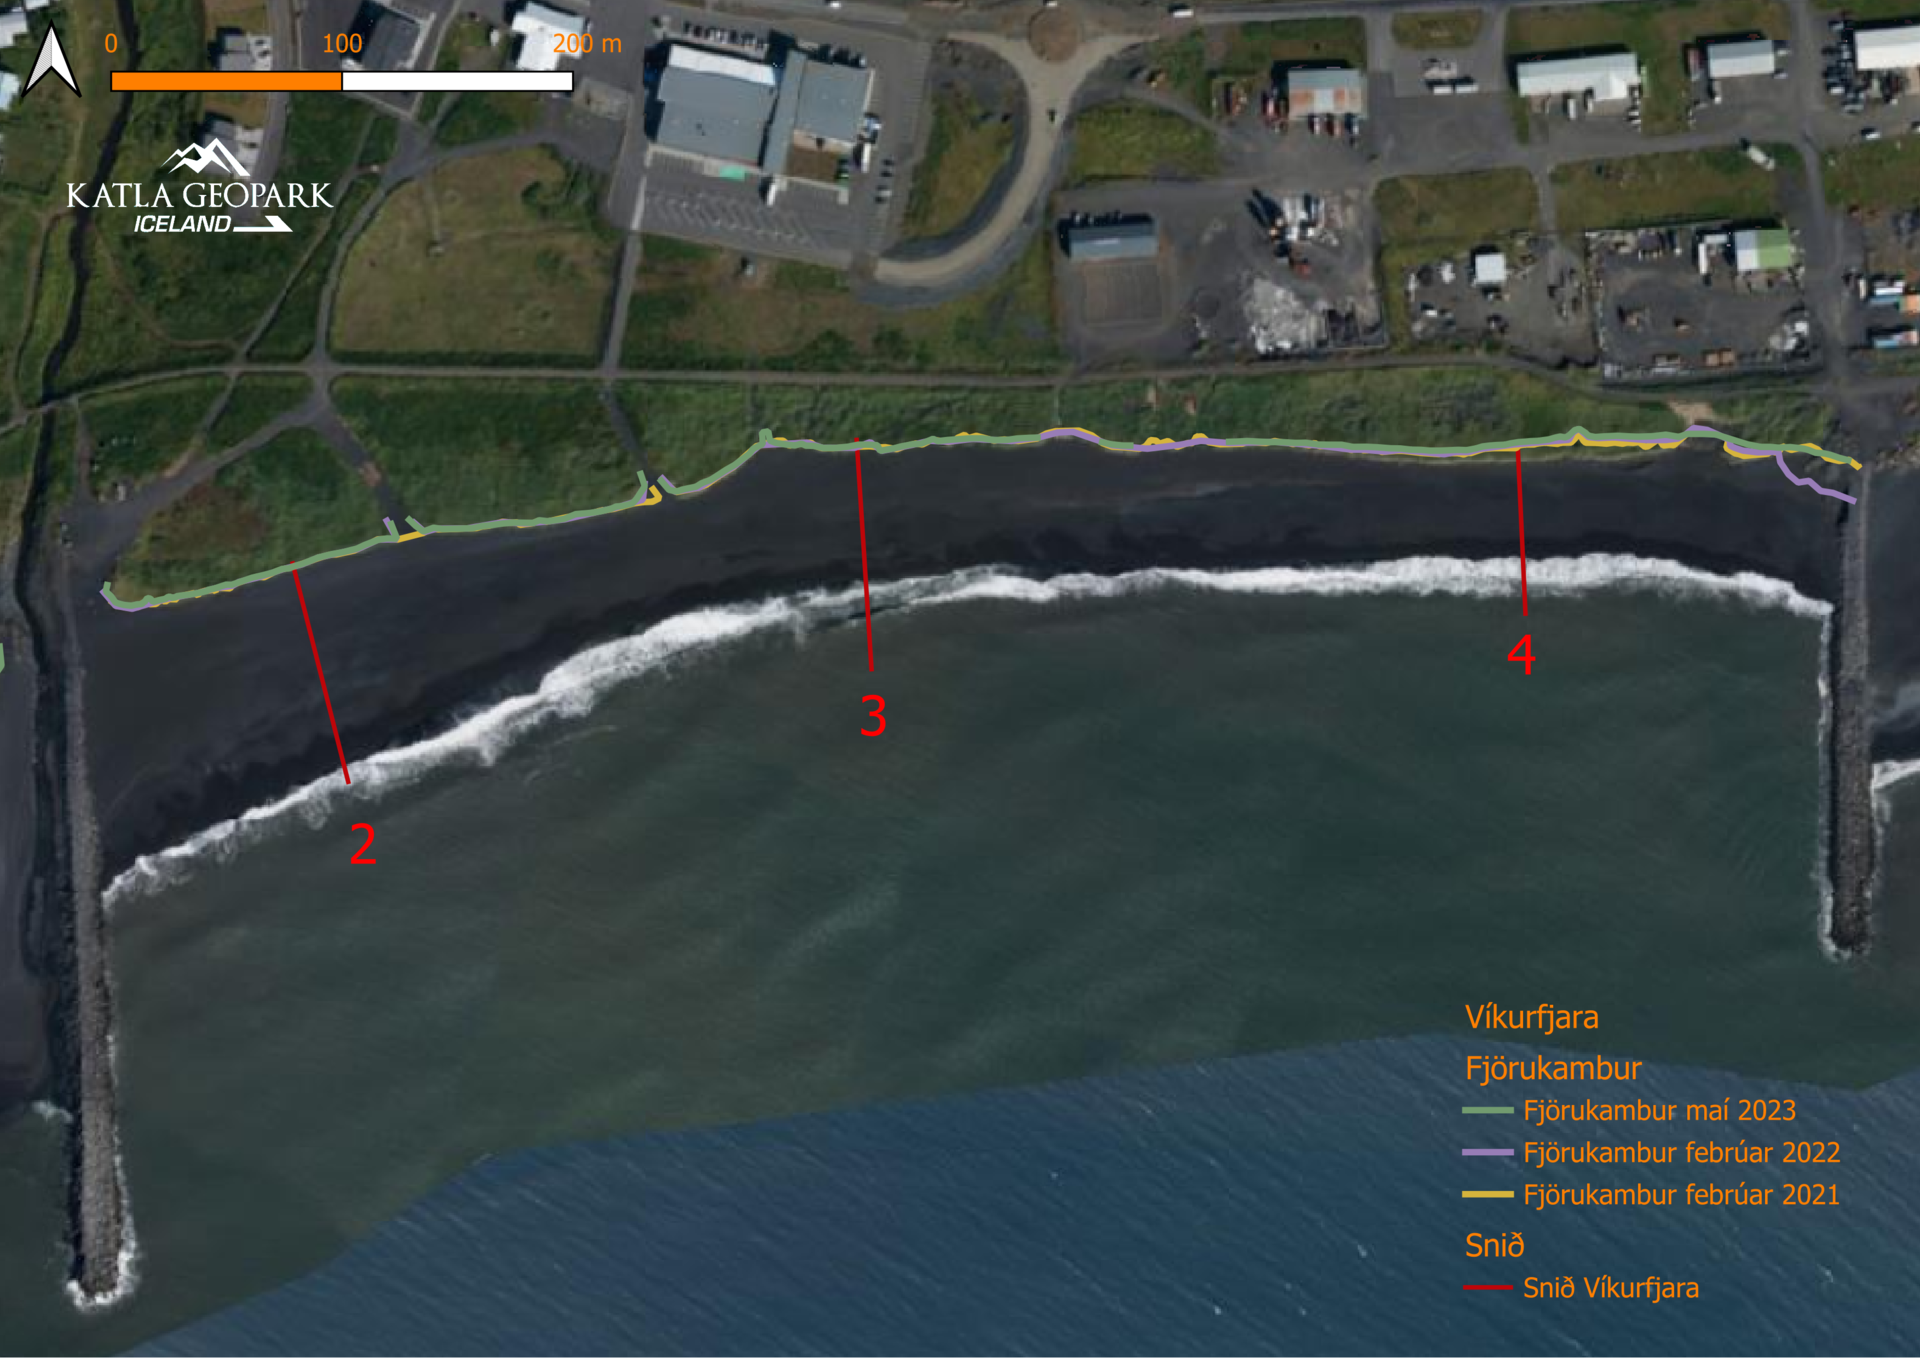
The beach ridge has been measured three times so far and the measurements can be seen in pictures 5 and 6. As can be seen from the measurements, the beach ridge in the western part of Víkurfjara beach, where profiles 1 and 1.5 are, had moved back slightly between measurements in 2021 and 2022, but has almost recovered to its 2021 extent in 2023. The beach there has built up rapidly in recent years, since the first groyne was built, and the old beach ridge is now so far inland that it has become stable, and waves no longer reaches it during storms. A new beach ridge will eventually form closer to sea level, but currently the vegetation is still moving closer to the sea. The measurement in the western part of Víkurfjara beach is therefore actually a measurement of the vegetation line of the beach, but these measurements together with the measurements of the two profiles will give a good insight into how a new beach ridge gets formed. It is therefore the vegetation line that had receded, not the ridge itself, which was most likely caused by sandstorms during the previous winter. Since the second measurement was made in February 2022, the Soil Conservation Service of Iceland (SCSI) has sown lime grass seeds in front of the beach ridge, and therefore the students' measurements will in the future map the area where the lime grass was sown, and in the process show whether the reclamation has worked or not. On the photo you can see where the are of the lime grass reclamation is (green dots) and it will be interesting to see if the lime grass will be able to take hold in the entire area.
The situation of the beach ridge between the two groynes is different, as the beach ridge is an old erosion scarp at the beach and is only partially covered by vegetation. Between the three measurements, erosion has occurred to the east of profile 4 and between profiles 3 and 4, but it is not extensive. There has also been landslides and erosion on the western part, but a part of it is due to tourist traffic on the beach, especially around the footpath that leads from the car park in front of Icewear. It can also be seen that considerable erosion have occurred at the beach ridge at profile 4 since the aerial photograph was taken, which was in 2020. It is therefore clear that erosion can still occur there, and the students' measurements will monitor this in the future.
Celebrating Earth Heritage
How to visit the Katla Geopark
Katla UNESCO Global Geopark is in central South Iceland